
A Customer from an international company with a business of automating manufacturing processes had a need to setup Logging, Monitoring and Alerting for the system they had. The solution that was needed is complex but it has a known solutions:
- Simple, like PRTG
- OpenSource, like Zabbix
- Corporate, like Icinga
- or Cloud-based like Grafana
We had an experience creating of Logging, Monitoring and Alerting solutions for both Software (Web applications and Services) and Hardware (Web Servers, Storages, Networks etc.) sides.
In our case we needed to create a Monitoring of Cloud-based infrastructure based on AWS EC2 that played a crucial role in Client’s infrastructure. Apart from EC2 instances we had to monitor multiple AWS MongoDB with sensitive data in it.
The reason we chose AWS-based solution was standing on three facts:
There were no need to use a separate instance of Logging & Monitoring solution like Zabbix for less than a 10 Metrics to Monitor.
Client’s system was AWS-based that comes together with CloudWatch service that was already part of Infrastructure, so we can use it for our needs
The easy way to integration of AWS CloudWatch to AWS SNS was solving the Alerting part of the solution we needed to build
While building the Architecture of the Logging/Monitoring/Alerting solution we chose AWS CloudWatch + AWS CLI over the AWS CloudWatch + CW agent + statsD/collectD because of simplicity of the solution and time saving reason.
The end solution Architecture was looking the following way:
A simple Bash script will be checking the Service activeness status:
systemctl is-active mongodWith the help of AWS CLI that was installed in the Instance we pass the results of Step 1 into AWS CloudWatch:
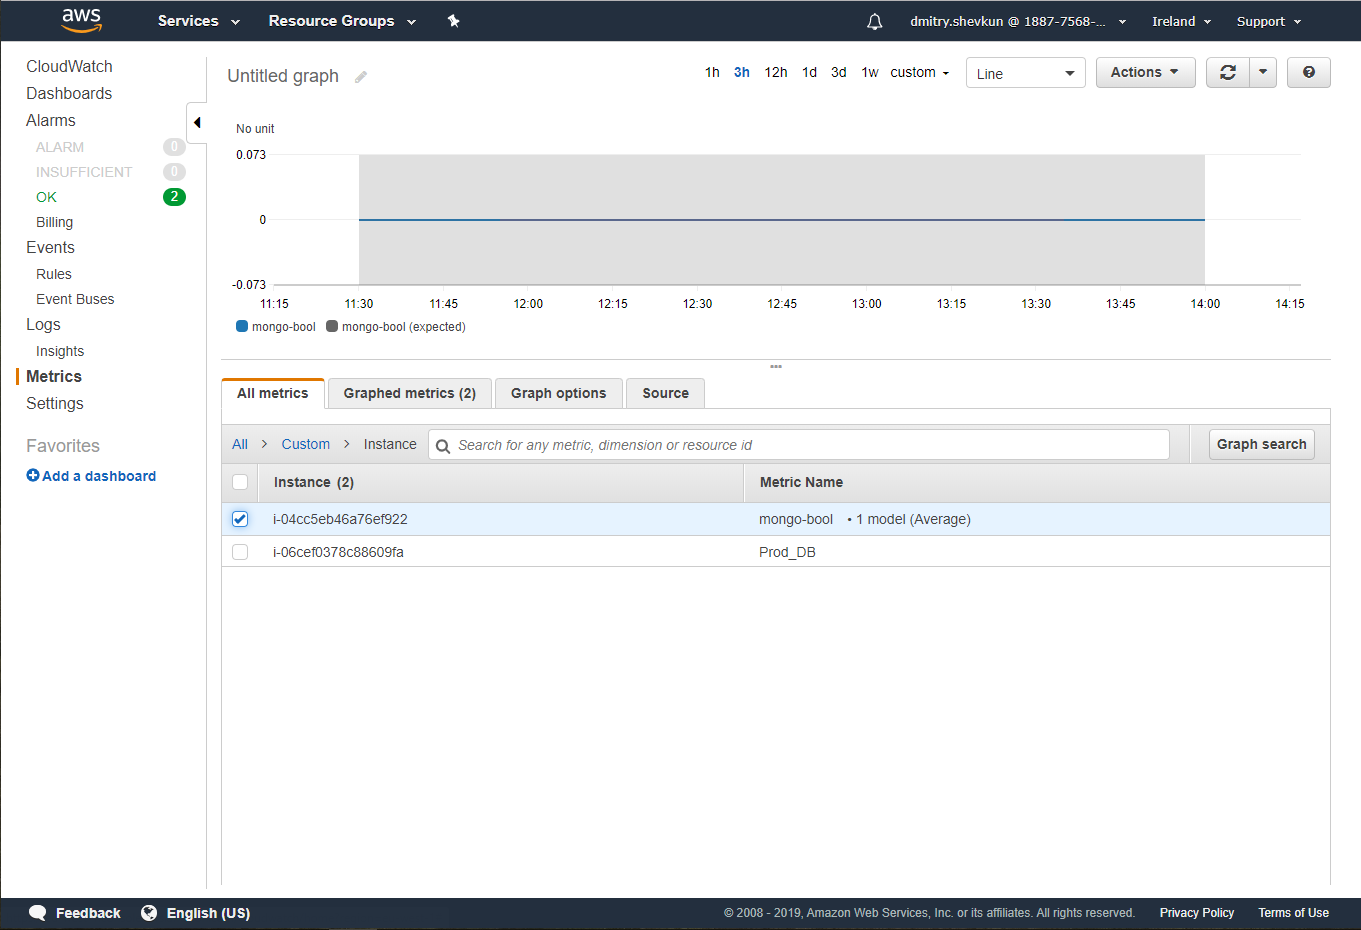
aws cloudwatch put-metric-data --metric-name my_metric --dimensions Instance=i-04cc0d647w76ef922 --namespace "Custom" --value 0 AWS CloudWatch process the received metrics and use the AWS SNS connection to send the Alert to the email that was set up.
To complete the above steps we have to do the following:
Create an IAM Object with Sending Metrics Rights and take credentials pair. Important note here is that it is better to create a separate Object for Monitoring purposes only so it would be easier to Manage the Security and to use the same isolated Object in the future.
Install AWS-CLI in the EC2 Instance. You most probably will be able to do it with any package manager of your choice but Amazon recommends to use Python PIP.
To add credentials you have to add a key pair in ~/.aws/credentials, you can do it either with console aws configure command or manually.
Create a Bash script that will send the Metrics. We choose Back because it gives a freedom of implementation. A command for sending the Metrics have standard view. It has a few values like Instance Name or Outbound Server, Metric’s Name and Metric’s Value. We send Object with a limited states that usually it is enough to have a state as numbers (ex. 1 – is true, 0 – is false)

Create Alarm in AWS CloudWatch based on the Metric that we have created. CloudWatch will propose to create AWS SNS Object of your choice that will be sent on Exceptions to your Developers.

You can find more info and some of the commands here:
https://github.com/DmitryShevkun/techinfo/blob/master/AWS/linux%20service%20monitoring